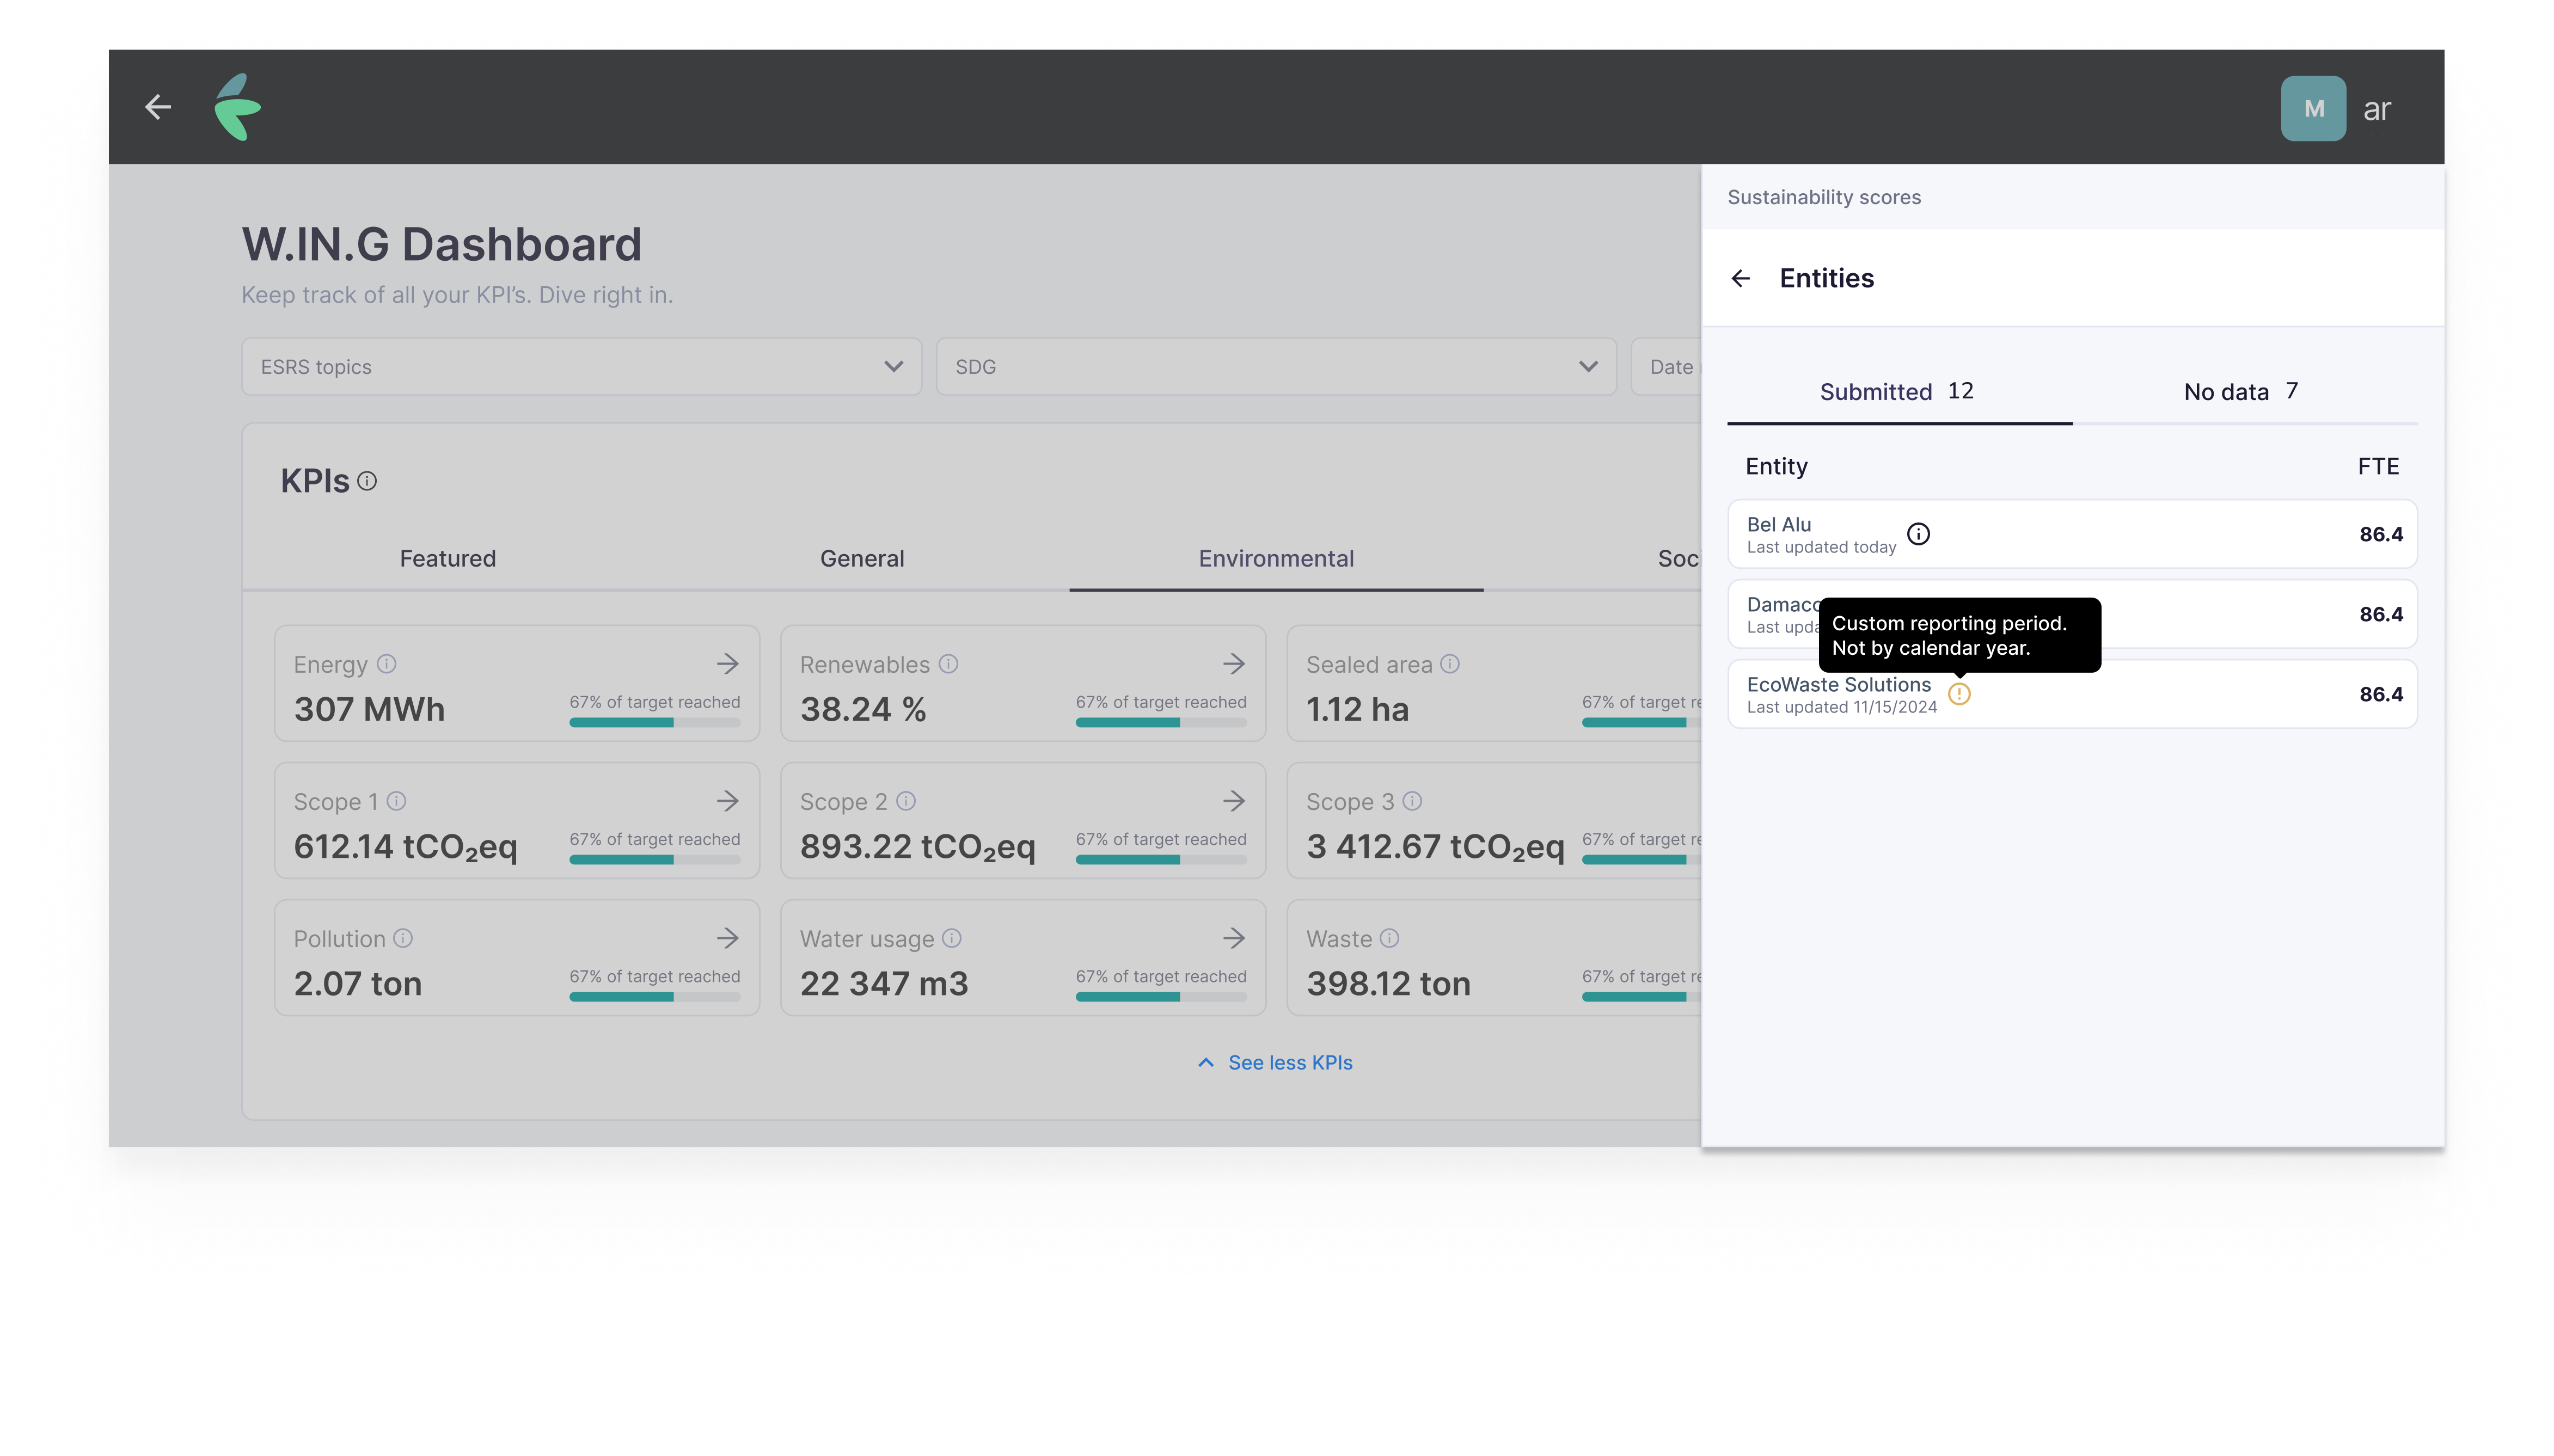
Aggregated Sustainability Dashboard
The aggregated dashboard gives you a portfolio-level view of sustainability performance across all companies you manage. For the per-company view, see Dashboard Overview.
Accessing the aggregated view
Navigate to the Dashboard page within the Partner navigation menu. You land directly on the aggregated view.
The aggregated values reflect an average across companies:
- that you have access to (based on groups), and
- that have already submitted and shared ESG data for the reporting period you selected.
Filtering by group
From the aggregated view, you can filter to see a specific group (e.g., fund or team).
What's different in aggregated mode
- Metric and score values represent an average across companies.
- Targets and materiality assessment are not shown — these are only relevant at the individual company level.
Metric detail view in aggregated mode
When you click a Metric while viewing multiple companies, the detail view includes:
- a completeness overview (who submitted vs who has no data yet), and
- a breakdown of the actual values for companies that have already submitted.