Sustainability Scores
Sustainability Scores show how well a portfolio company addresses its material sustainability topics, based on evidence in its submitted sustainability report.
What you can do
- See which topics are in scope for each company (material topics).
- Compare scores across companies.
- Open any score to view the dimension breakdown and the AI rationale behind it.
How scores are calculated
As soon as a company completes their sustainability report, Karomia automatically calculates all sustainability scores.
Each score is made up of two or more dimensions. Each dimension is scored on a 0–3 scale, based on evidence in the company's submitted and shared ESG assessment. Each score, in turn, has a factual, verbal description — a set of criteria that need to be met in the sustainability report for the company to achieve that score.
Karomia AI assigns the highest justified score for each dimension and generates a rationale explaining why that score applies and why a higher score was not attained, referencing the underlying sustainability report.
How scores are aggregated
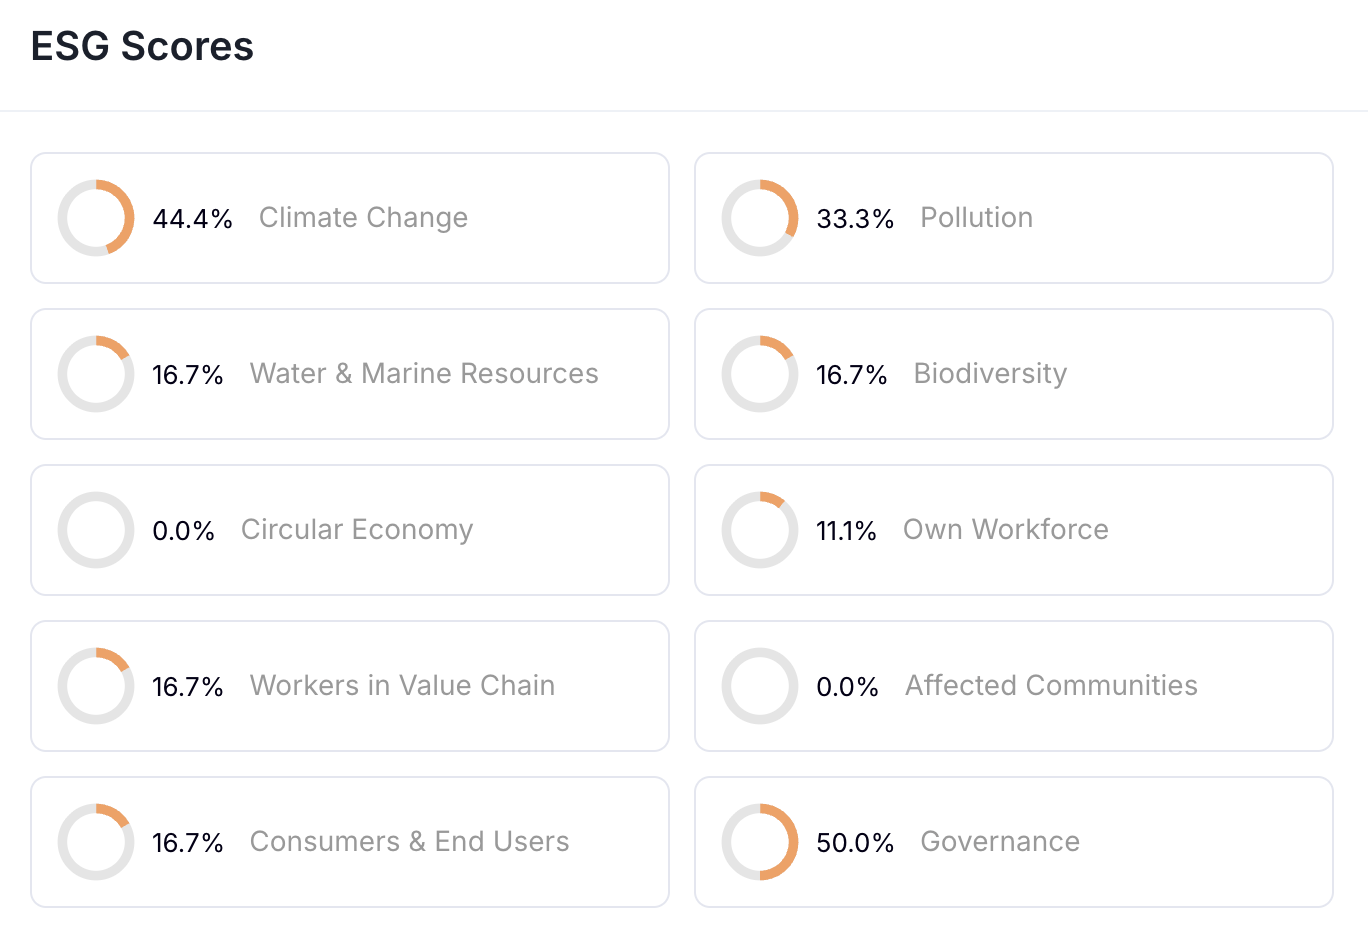
A topic score (e.g. for Climate change) represents the average across its underlying dimensions and is presented as a percentage (0–100%).
An example:
| Scope | Score | Calculation |
|---|---|---|
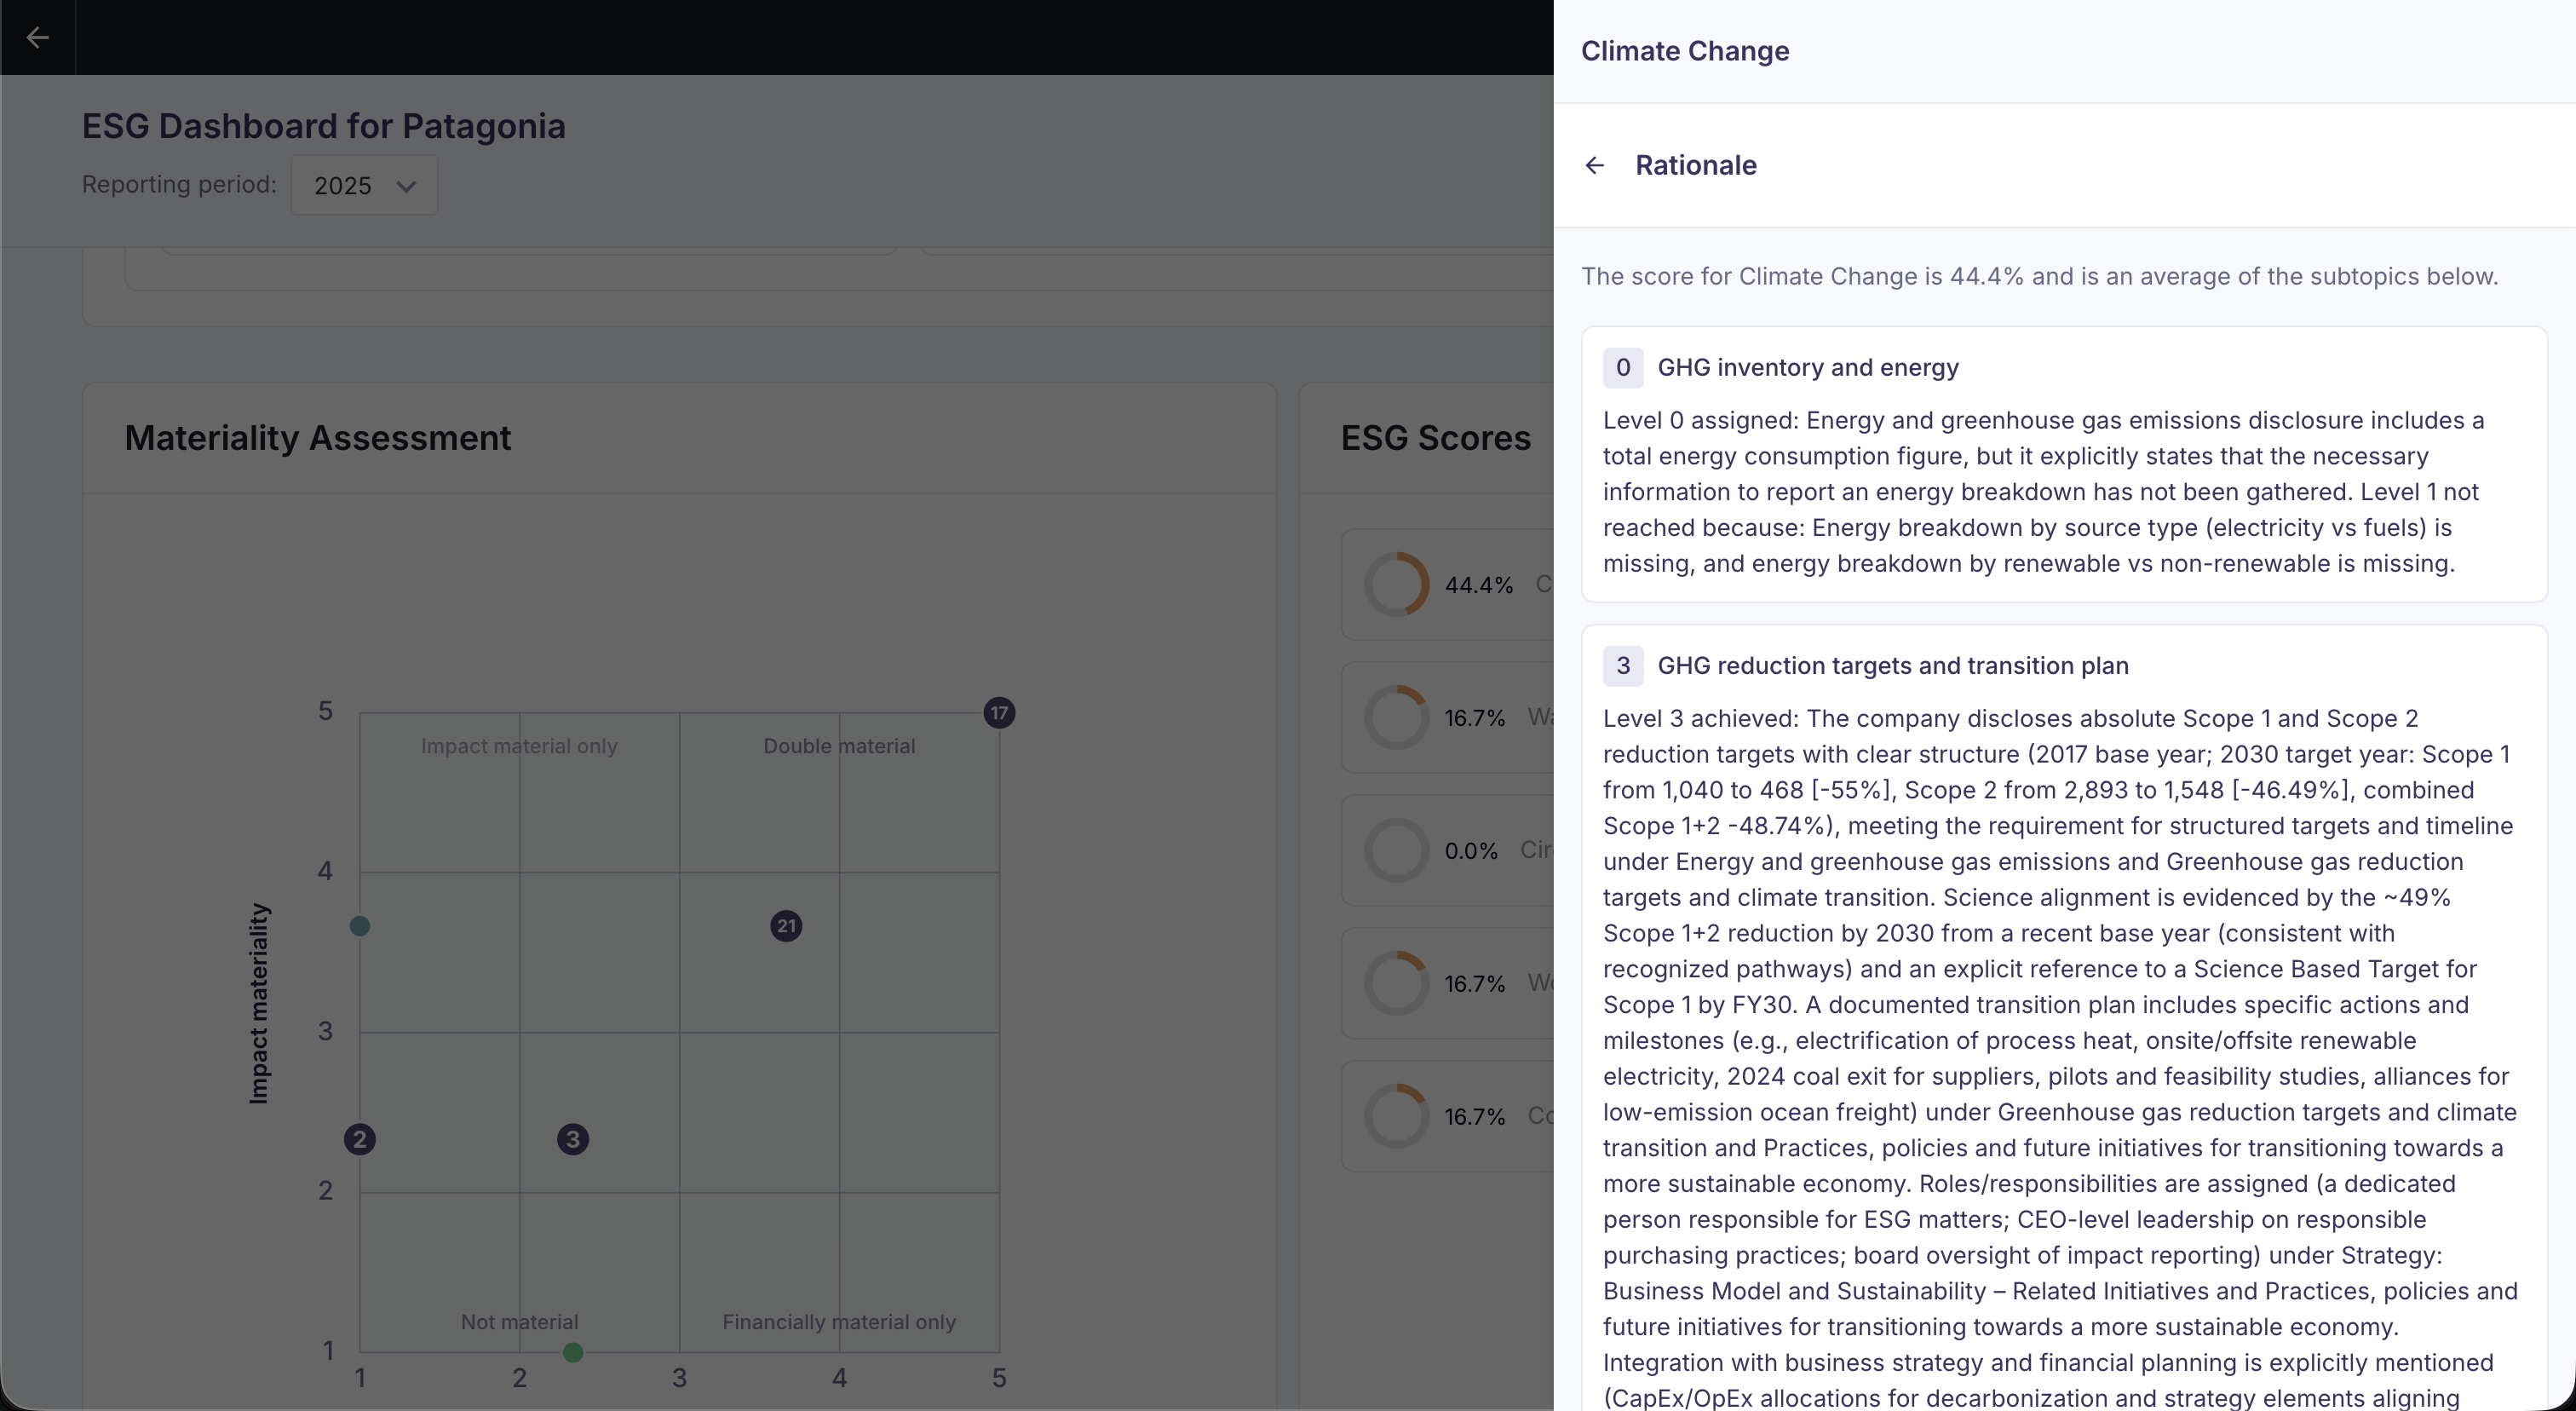
| Topic: Climate change | 44.4% | Average of underlying dimension scores: (0+3+1)/3 = 1.33. 1.33 on max score of 3 = 44.4% |
| Dimension: GHG inventory and energy | 0 | |
| Dimension: GHG reduction targets and transition plan | 3 | |
| Dimension: Climate risks and adaptation | 1 |
Topic scores are aggregated into category scores: Environmental, Social, Governance. Each of them is again the average of the underlying topic scores that are included in the dashboard for a given company.
These 3 category scores are, in turn, averaged into a single overall score.
Viewing scores in the dashboard
Company view (deep dive)
In the Sustainability Dashboard, you can open any score to see:
- the topic's dimension breakdown, and
- the rationale per dimension (what evidence supports the score and what would raise it).
Aggregated view (portfolio)
In aggregated mode, you can see:
- average topic scores across companies with calculated scores, and
- an overview of completeness (who submitted their report and who didn't yet).
Scoring principles
Our scoring approach is designed to be:
- Objective and consistent: Uses stable scoring rules to keep results comparable across companies and reporting cycles.
- Company-aware: Differentiates between company types by scoring only the topics that are material to that company.
- Hard to game: Encourages evidence-based reporting and reduces the risk of greenwashing.
- Transparent: Each score can be opened to see how it was calculated and what would improve it.